Now comes the interesting part which is self-analytics of all the data that I have collected from “the Internet of My Things” (IoMT). As a recap I am currently ingesting activity data points from 2 devices, a Fitbit One and a Samsung S4 running 2 “sensor apps”; Strava and MapMyWalk. But it shouldn’t be limited to this as I also have a Garmin Edge 705 with heart-rate monitor (HRM) to track my MTB rides and a Polar FT40 wrist watch also with HRM to track other activities such as badminton and swimming (yeah my one and only wearable device which works under water). I have a small disclaimer: I’m not a regimented fitness geek. I just want to make sense of my activities. It all started with mountain biking and I just want to know how often I ride and for how long to try to justify to my wife why I bought 2 mountain bikes! 🙂 During my rides, I wear a HRM because I just don’t want to over-exert myself during those steep climbs. When I looked at my dashboards I realized there is so much information which helped me to gain insights as to what I’m doing well and what not. It helps me to be better when I ride or play sports all without “killing” myself.
I chose PowerQuery and PowerMap, 2 very nifty PowerBI add-ins. I just want things to be simple and nothing beats self-analytics using a friendly tool like Excel (my wife is quite an Excel junkie from her previous life). These add-ins are available as free downloads from Microsoft to enhance the data access and data visualization capabilities of Microsoft Excel 2013. You should search for the latest download links. Using these tools I could retrieve data from a variety of sources and integrate that data as part of my Excel data model.
I’m particularly impressed that in the “Internet of my Own Things” the data generated were pretty sizeable. There were over 8000 Fitbit data points and 6000 Strava data points over a few days. And this is just for myself, imagine opening this up to more devices and more users? Obviously we needed a solution that is of cloud-scale to make this work. If you are doing self-analytics using Excel 2013, you may want to install a 64-bit version of Excel. Your Excel may crash working on all that data, I’d crashed the PowerQuery and PowerMap add-ins a few times, sent in feedback to Microsoft, they asked me if I could reproduce it, I say yeah when I work on huge datasets, they recommended I use the 64-bit version. Remember to download and install the corresponding 64-bit versions of the add-ins too.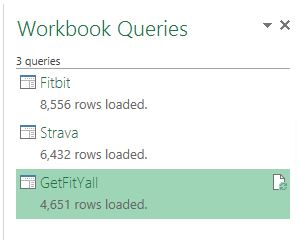
These data were retrieved from my Azure Table Storage which my Worker Roles diligently inserted (see my previous post). You could also import data from other sources which include Facebook, that’s pretty fun. Imagine being to compare my activities with my other buddies. I am a member of a couple of mountain biking groups in Strava. This could be a side-project later on.
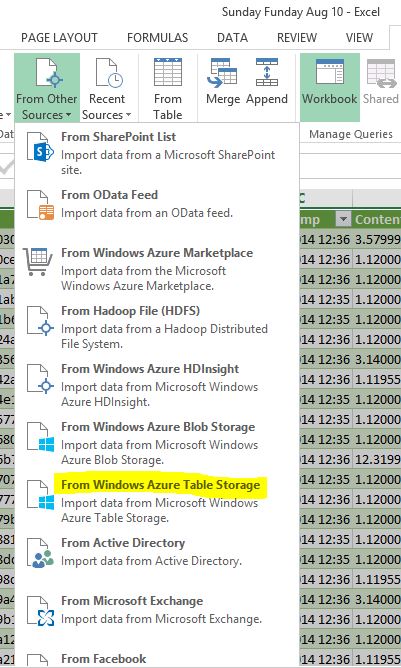
You need your storage account details such as the name and the storage primary key which you can get from your Azure management portal.
After I had retrieved data from 2 Azure storage tables which stored my Fitbit and Strava data points, I could “mash” them y’all. The function for this is merge within PowerQuery ribbon. First I select the Strava table, and then the Fitbit table. This is because there are more data points in Strava that maps out my lat/long coordinates versus 1 Fitbit data point recorded at every minute interval. Then I select the datetimestamp column to match and I only want to include matched rows. I name my merged query as Getfityall. Voila, I had just mashed up both data sources without writing any code! I had tried to write the code to do the matching but I don’t think my code was all that good, I had nested for loops. I then tried to use JSON path but a JSONpath library I used was painfully slow. So guess what, I just let Excel do what it does best! However in a later post, I will talk about how to import the mashed up data in Excel by calling a REST endpoint that returns the mashed up data in JSON. And in this implementation I do have nested for loops written in node.js! (yeah please do LOL :))
Things to note when you merge the 2 tables in Excel. you have to adjust the column formats especially for date/time and steps (by making it a whole number). Otherwise PowerMap doesn’t understand the format of your data and would be unable to render it. Then remember to load the data into the data model. This is required by PowerMap.
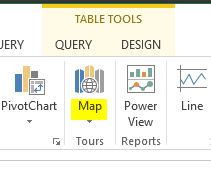
Next you insert a PowerMap. It is not available as a ribbon on its own. Rather go to the Insert ribbon, and under Map, click on it. You will notice a Launch PowerMap option. Wonder why is such a powerful feature tucked away here.
Create a new PowerMap tour and the fun begins. Select the latitude and longitude columns. It should automatically map correctly. Next I select other columns such as DateTime, Steps and CaloriesOut.
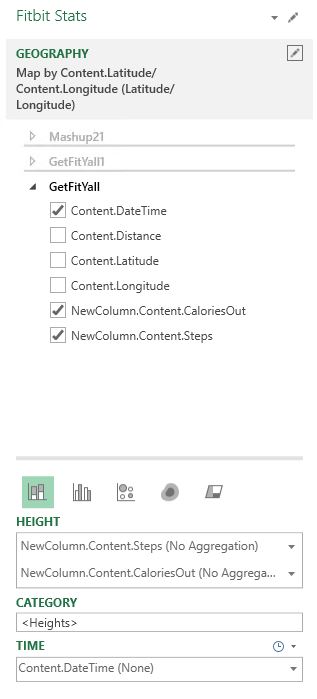
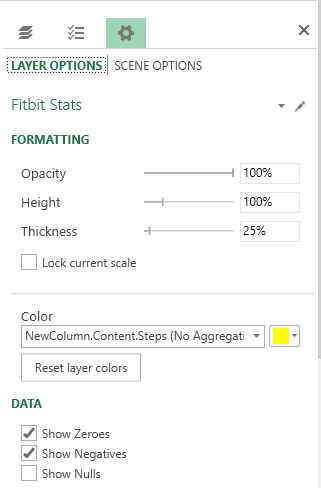
Be sure not to aggregate your columns under height. Otherwise you get weird-looking “skyscrappers”. Next I configure the layer options by making the thickness smaller to about 25%, otherwise I get fat buildings and I can’t even see the route on the roads when I click play. I also changed the layer colors accordingly. I chose the national colors of Australia, green and gold to represent my steps and calories.
Turn on the map labels. Change the playback speed. Pan, zoom in and zoom out and just play around with the map. Then create a video and it’s cool! You could even add a soundtrack!
There you go, self-service analytics of data captured from the Internet of my things. This is just descriptive analytics, I’m just visualizing data that I already have. Next you could advance to predictive and prescriptive analytics which opens up many more possibilities. In another post I will talk about my thoughts about how far we have progressed being able to derive value of out of your own IoT solutions and projects in such an accelerated manner. And the best part is that you only focus on what you do best without worrying about the underlying plumbing and infrastructure. It just works!