Is that even possible? Yes and I’m talking about invoking that from within the PowerQuery add-in in Excel 2013, and then mucking around with the data which is represented in JSON. Pretty awesome I would think. To the layman, don’t worry about what’s this JSON thing, it’s all transparent to you, just consume the date.
In my previous post, I wrote about the REST API which I had exposed and it allows mashup on-demand which is perfect in the case of self-analytics using PowerBI. Here’s how you could consume this API from within PowerQuery specifically. It’s just another source of data like how I had retrieved the data from Azure Table Storage. Here are the steps:
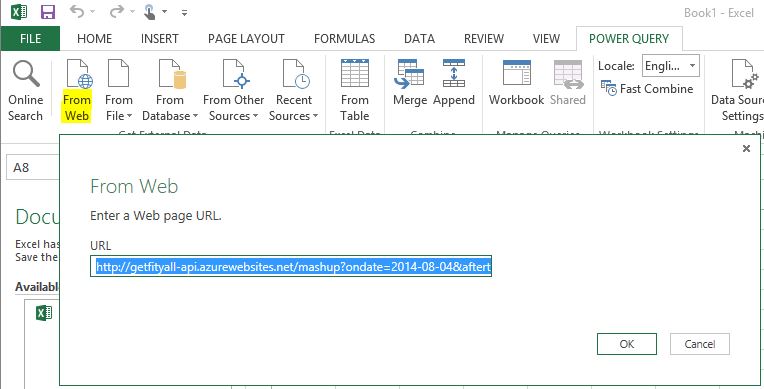
1. From the PowerQuery ribbon, click “From Web”. Then enter the URL. The URL I’m entering is the REST endpoint I have. It should be HTTPS but then this is just a PoC so I’m keeping things simple here. I pass some query strings in the URL too.
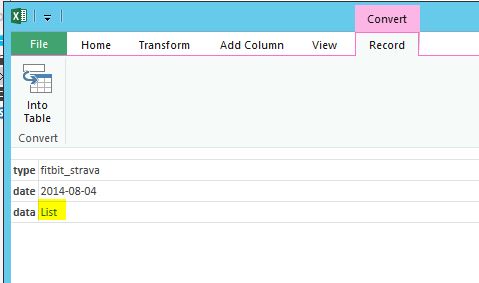
2. Click List which contains an array of mashed up activity data points. Do NOT click “Into Table”, at least not yet.
3. Now that you have expanded the List into a row of records, click “To Table”.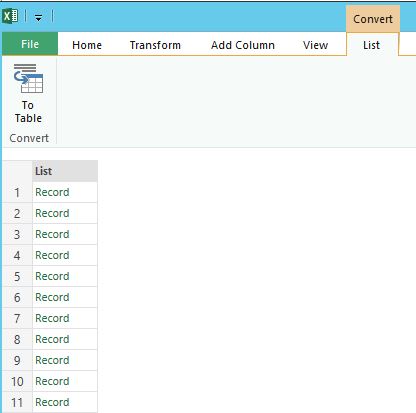
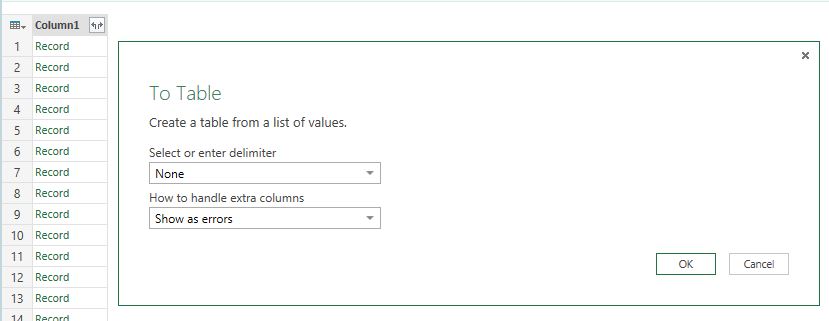
4. Then you see the following dialog box, just click OK. No worries, it’ll be fine.
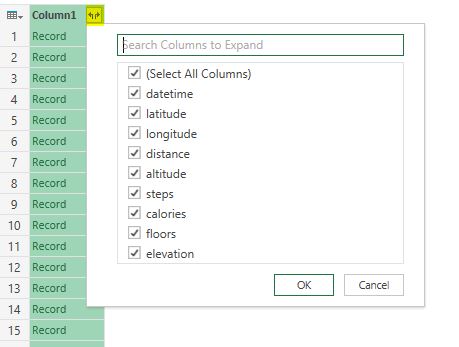
5. Select All Columns.
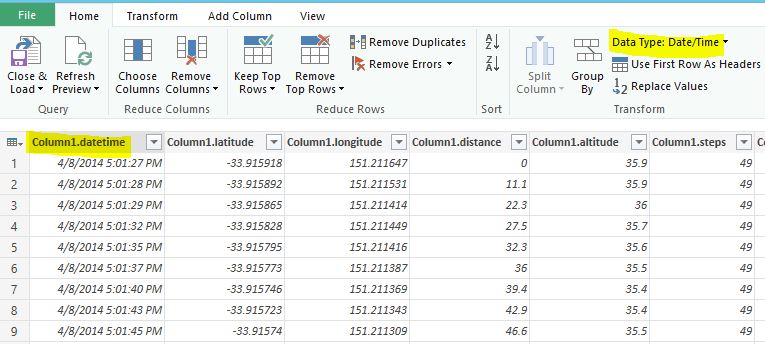
6. Fix the data type for the fields you care about, especially those you want to be used to visualize in PowerMap. Start with datetime. Click the column header, then at the ribbon, select Date/Time as the Data Type.
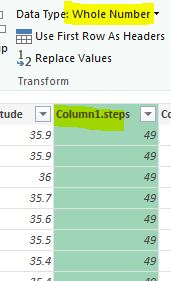
7. Fix Steps column as well. Choose Whole Number. This is because you don’t have a fraction of a step, just steps. 🙂
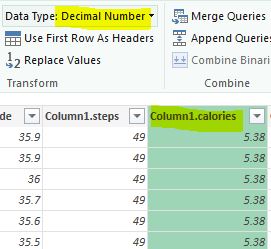
8. Fix Calories column, and set Data Type as Decimal Number.
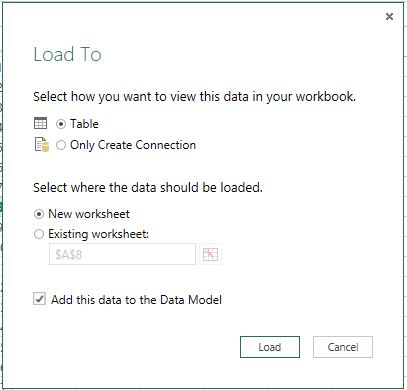
9. At the ribbon, click Close and Load To. Then this dialog box pops up. Be sure to tick “Add this data to the Data Model”. The data needs to be in the Data Model in order for PowerMap to work on it after this.
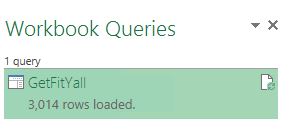
 10. The results are a number of rows retrieved from the REST endpoint. Look man, no JSON 🙂
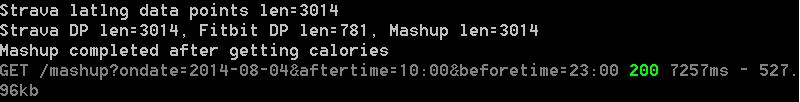
11. If you want to look under the hood, I happen to be “tailing” the log of my node.js Azure website. Here’s proof that it’s the same 3,014 rows being returned. It took some 7 seconds to execute, this is what I mentioned in my previous post that I might not have optimized the mashup logic.
That’s it on the part of PowerQuery. Let’s do the fun stuff of visualizing this on PowerMap.
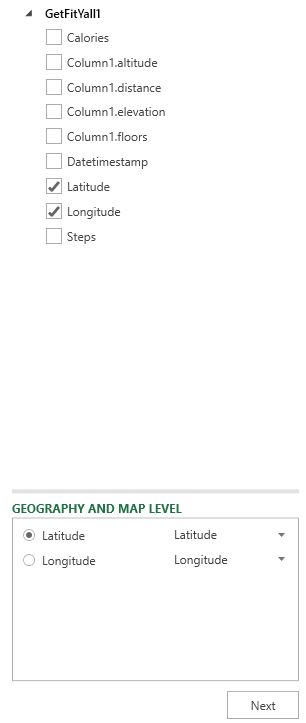
1. Map the geography and map level by selecting the lat and long fields.
2. Select the columns which we want to visualize in the PowerMap.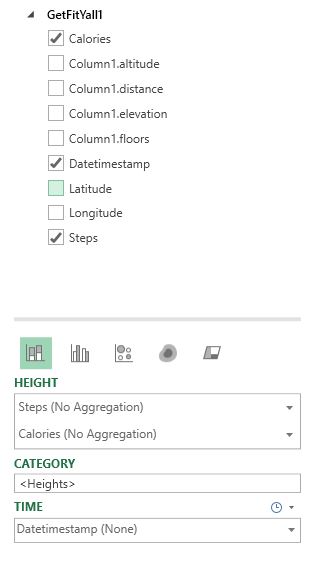
3. Change the width of the “skyscrappers” and the colors of course, and VOILA, you get this birds eye view of where the “action” happens. In this case, I walked the most around the Sydney CBD area. I attended the Mobile Monday Sydney meeting a couple weeks ago. 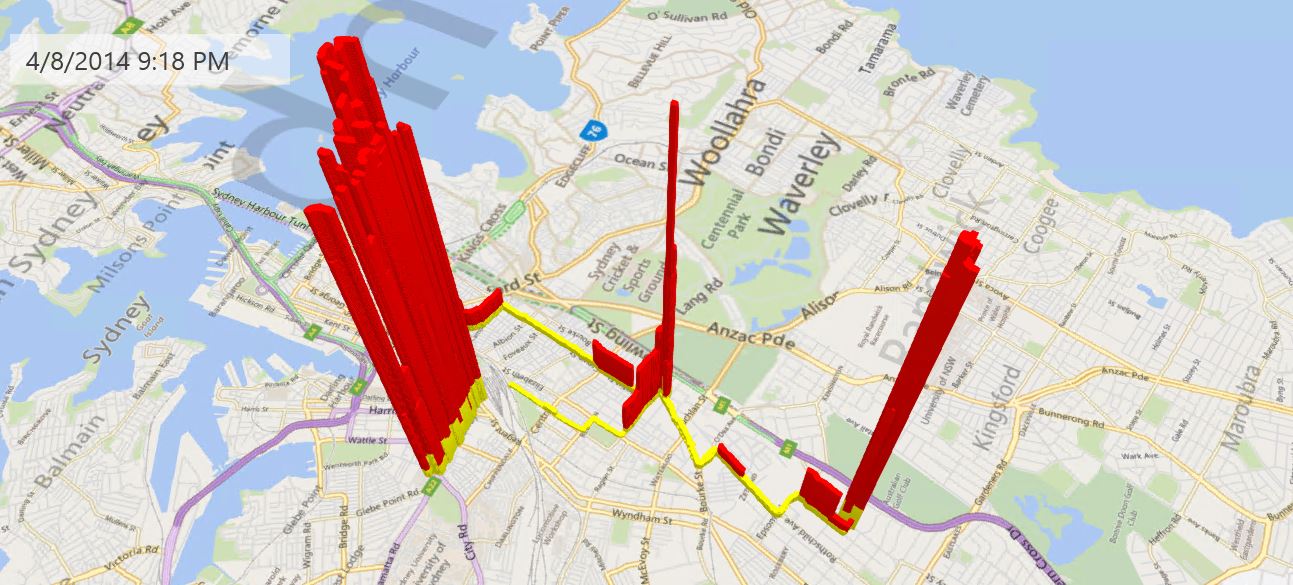
When I showed this to my wife the other day, she asked why were calories burned even when I was sitting idle in the bus. But then she answered her own question when she said “oh yeah we burn calories so as long as we are breathing!” LOL 😀