Here’s a sneak peak of what I got. The end result is the ability to do self-service analytics on my daily activities by doing a data mashup of Fitbit and Strava activity data points. This is not really enterprise-grade, just a fun personal project, but in later posts I will discuss more about making it more “enterprise-grade” by decoupling all the mashing work to an Event Hub and Azure Worker Roles. Sure I’ll even defend why I use this later but don’t beat me too much to it.
I just want to be able to do some self-service analytics using Excel 2013’s new add-ins called PowerQuery and PowerMap. Why Excel? Well because I have it and I think it’s rather ubiquitous.
Why Fitbit and Strava? Fitbit One is a device I carry with me all the time, and Strava is an app which was intended for cycling (because I’m an avid mountain biker) but I use it a lot and I am glad that this app is really power-friendly in not draining off my smartphone battery when I record my activities. So the simple task is to create a IoT gateway proxy with 2 endpoints, but let’s just start with the first end-point which is the following:
GET /v1/mashup?ondate=YYYY-MM-DD&aftertime=hh:mm&beforetime=hh:mm
I’ve not turn the endpoint live yet in the cloud will do so soon.
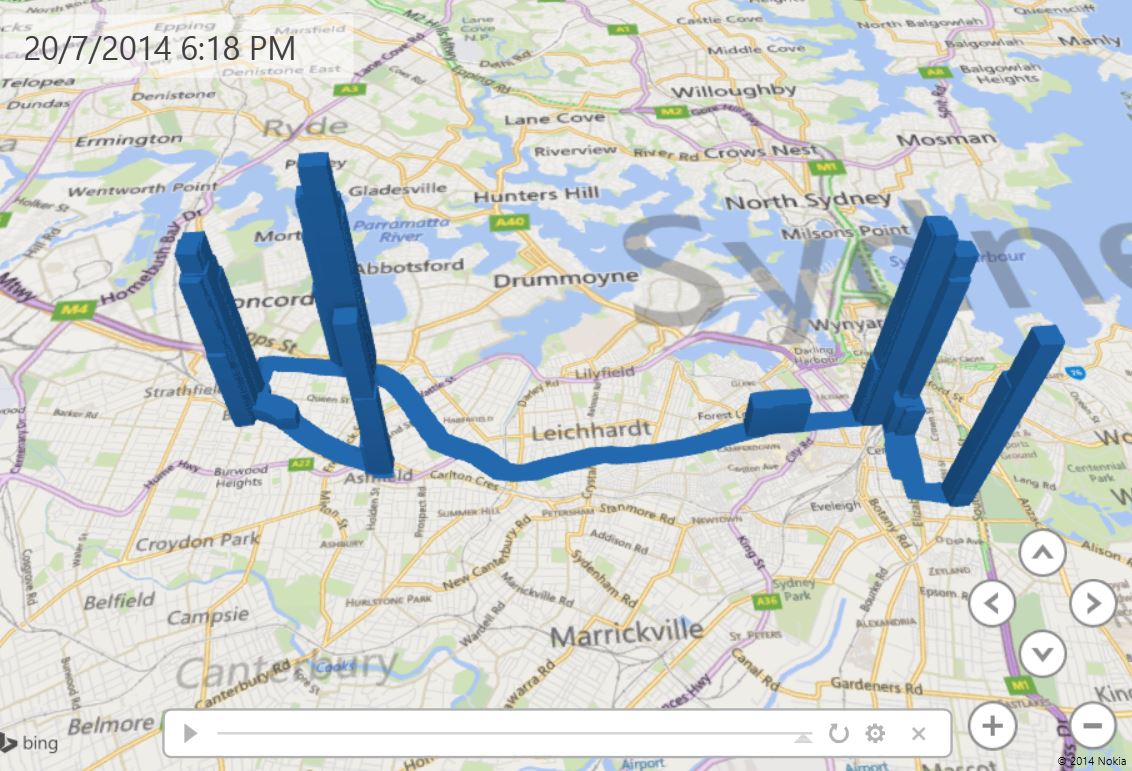
The end result, a visualization of where I spend my activities, when, and how. This is the PowerMap, very powerful indeed. Those skyscrapers in the map below are not new building in Sydney but rather a representation of my steps count as recorded on Fitbit and the lat/long coordinates recorded by the Strava app. A quick tour of what I did a few Sundays ago:
- Skyscraper #1 – I left my apartment in Waterloo/Redfern area, walked to the bus stop with my family
- Skyscraper #2 – Alighted at Central station, walked to the other side of the station to catch another bus
- Skyscraper #3 – Got off at Parramatta Road to go to a kid and baby Sunday market, can’t remember the name of the place but from the map it’s somewhere near Barnwell golf course. This kind fits the purpose of why I build this, to remember where I’d been considering I’m really new in Sydney.
- Skyscraper #4 – After much shopping for kid and baby stuffs, we were starving, so we went to Westfield Burwood for lunch
- Skyscraper #5 – Did some groceries around the commercial area near the Burwood train station
- Skyscraper #6 – Walked back to apartment from the bus stop
Here’s the Excel spreadsheet which packs all these goodies, but the actual data is pulled from Azure Storage tables.
Just download these two add-ins to get started.
PowerQuery – http://www.microsoft.com/en-au/download/details.aspx?id=39379
PowerMap – http://www.microsoft.com/en-au/download/details.aspx?id=38395
The brains behind all of this: it’s all in Microsoft Azure. I’ll just quickly summarize the technologies I used:
- Cloud services – virtual machines to be exact
- Azure Service Bus Event Hubs
- Azure Worker Roles
- Azure Storage tables
You can take a look at a rough sketch of the architecture below:
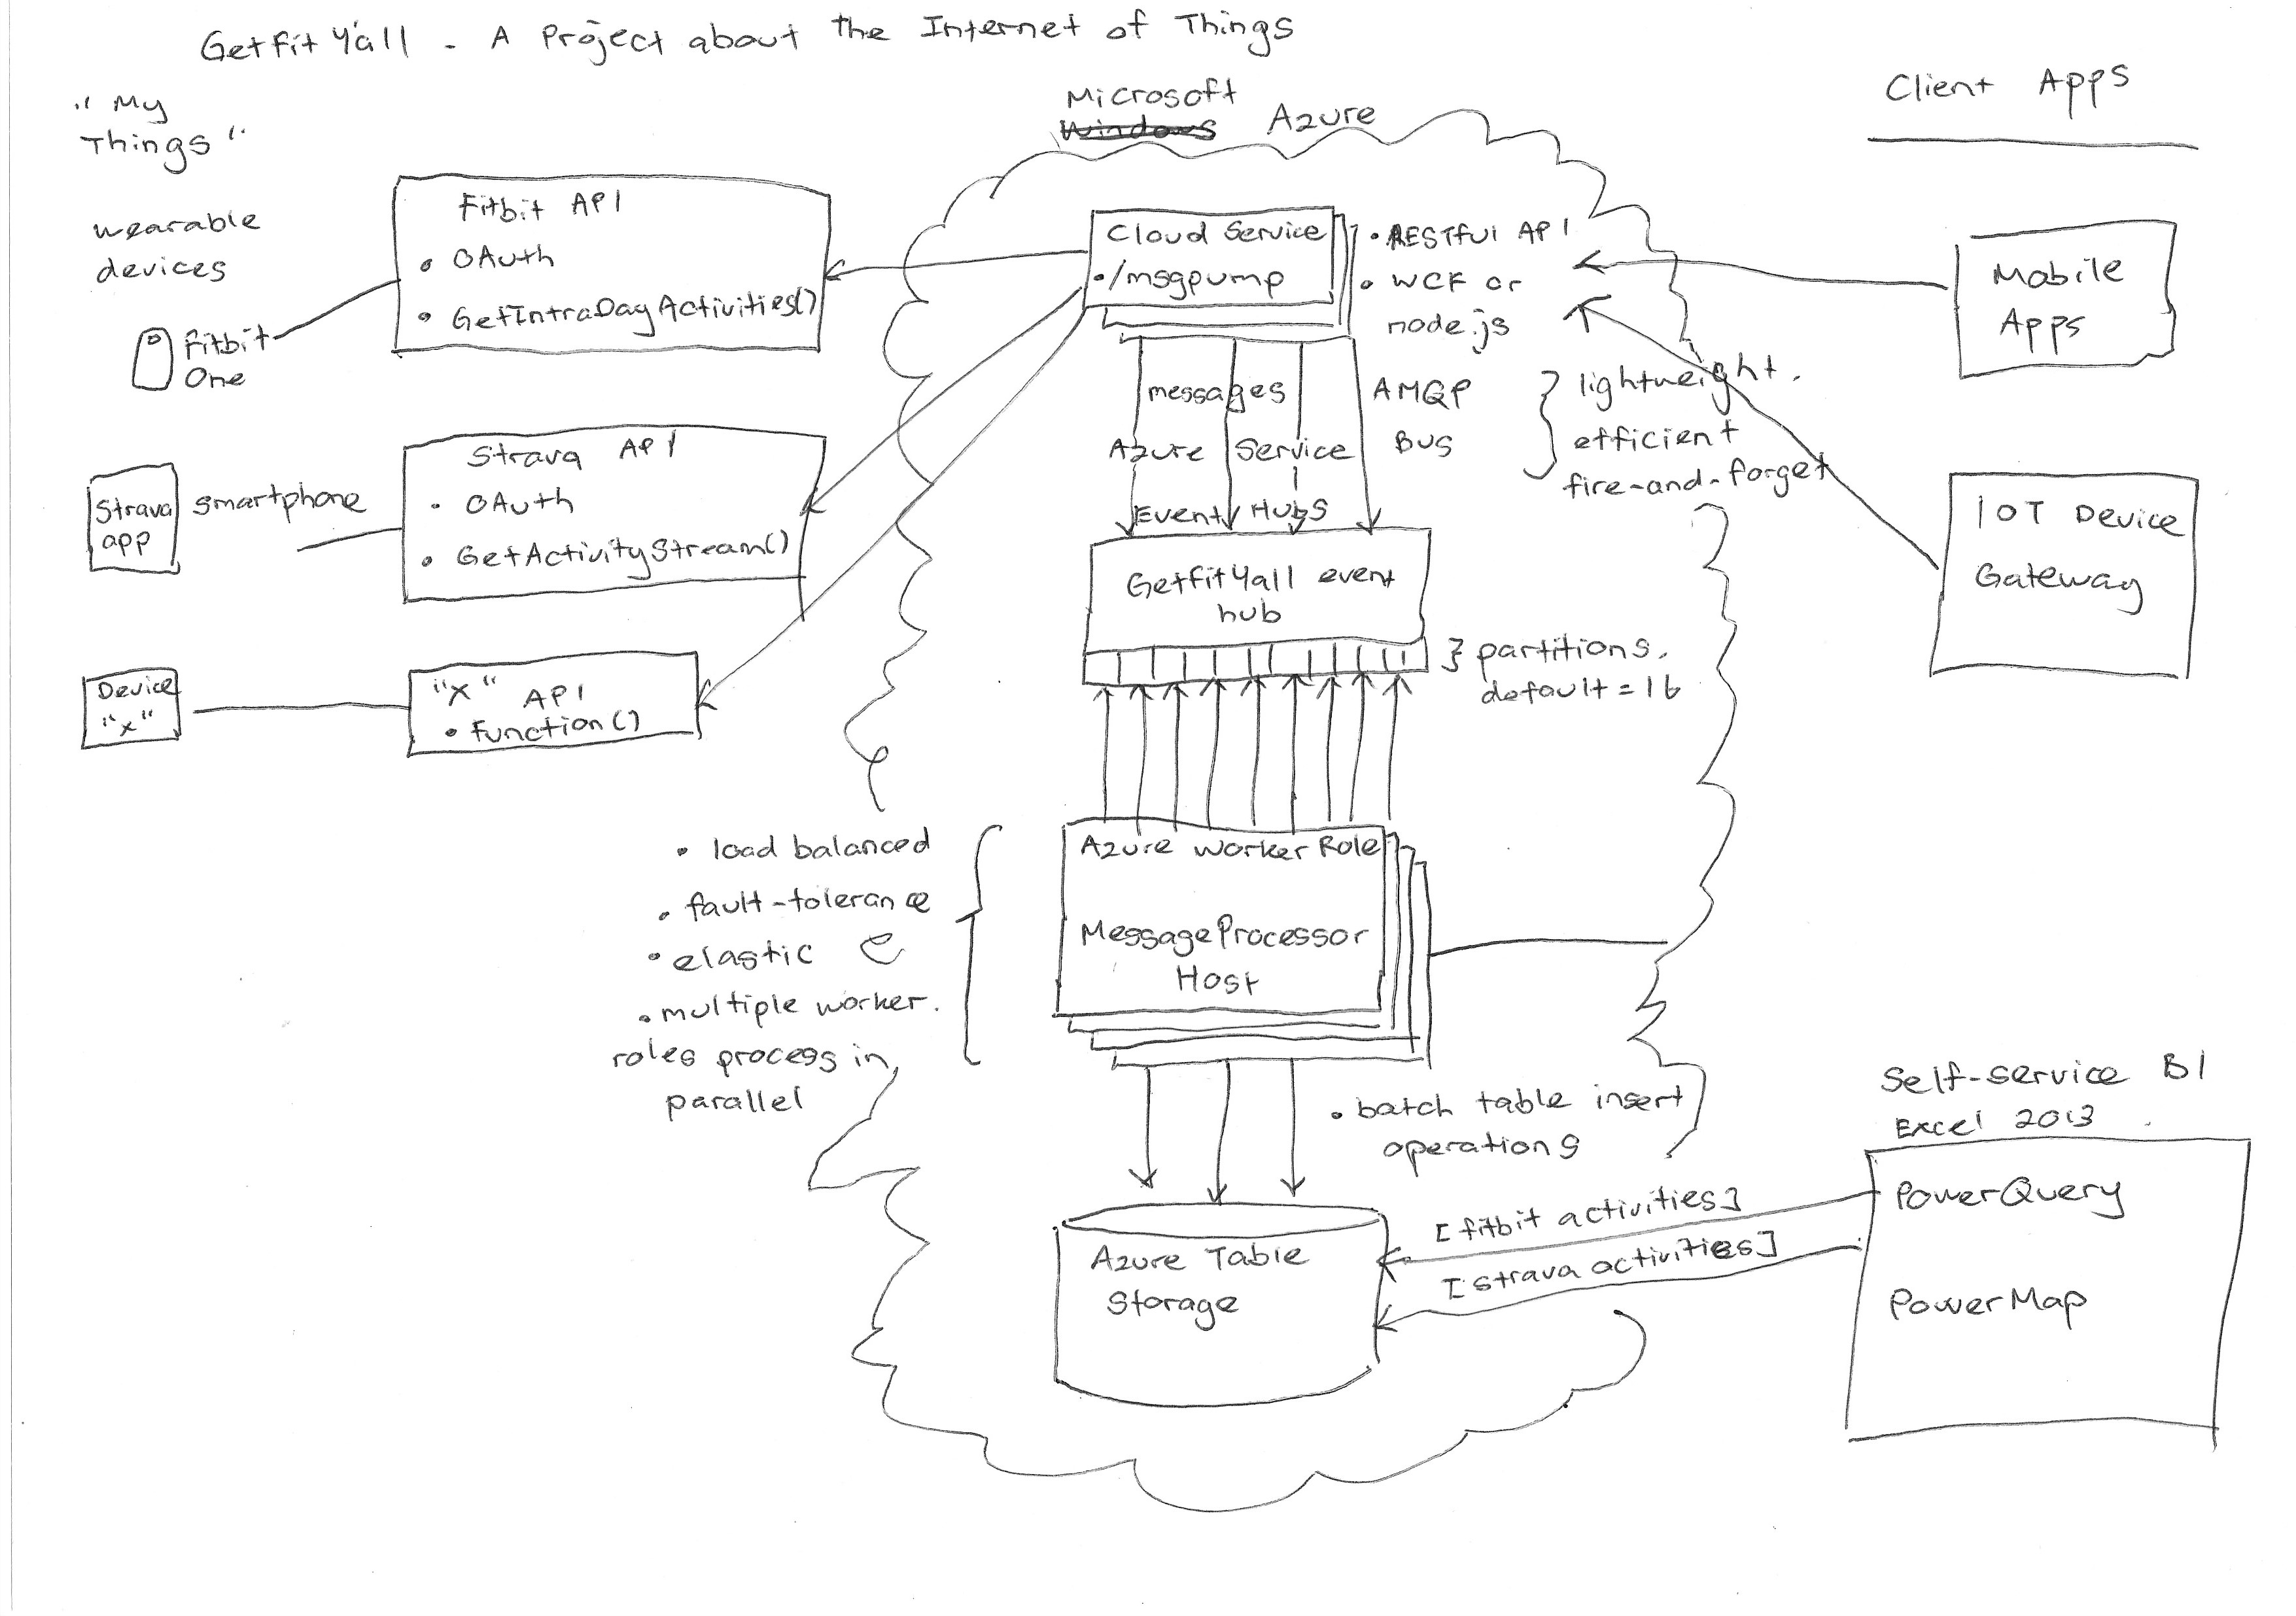 Disclaimer: I’m not an enterprise architect, just know enough to get a quick IoT POC moving.
Hope you like it. My next step is to tighten this up and I’m also exposing this as a well-designed RESTful API, hopefully.